

Simulation Metric : Solar Energy Density / Solar Radiation
Location : Pittsburgh
Performance Objective(s) : Understand the effect of incident solar radiation on facade surfaces
Analysis Period : Seasonal, Annual, 10:00am - 7:00pm
Summer : July 1st to September 21st
Winter : January 1st to March 20th
Annual : January 1st to December 31st
Source : .stat weather file

Summer, Winter Months vs HDD and CDD
This graph compares the summer and winter months (as mentioned on the *stat file) with the heating and cooling degree days. Summer has more cooling degree days and winter has more heating degree days.
Geometry Definition for Analysis:
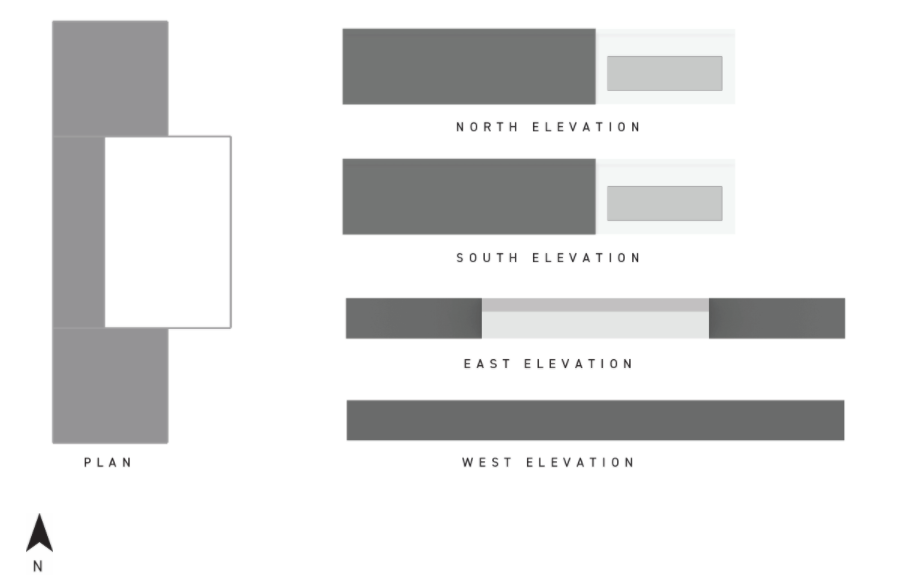
Building Facades as Base geometries
The target building (in white) has existing glazing on its east facade whereas the windows on the north and south facades have been proposed (with 40% WWR as mentioned in Time-Saver Standards). It is surrounded by buildings on three sides (seen in grey) out of which the west elevation is not exposed to the sun.
It has a rectangular plan, and the faces of the walls facing a single direction are continuous. The roof is flat with no overhangs, and some walls are shaded because of the adjacent building.
For the base case analysis, the analysis grid is generated by assigning the facades that need to be considered for radiation mapping.
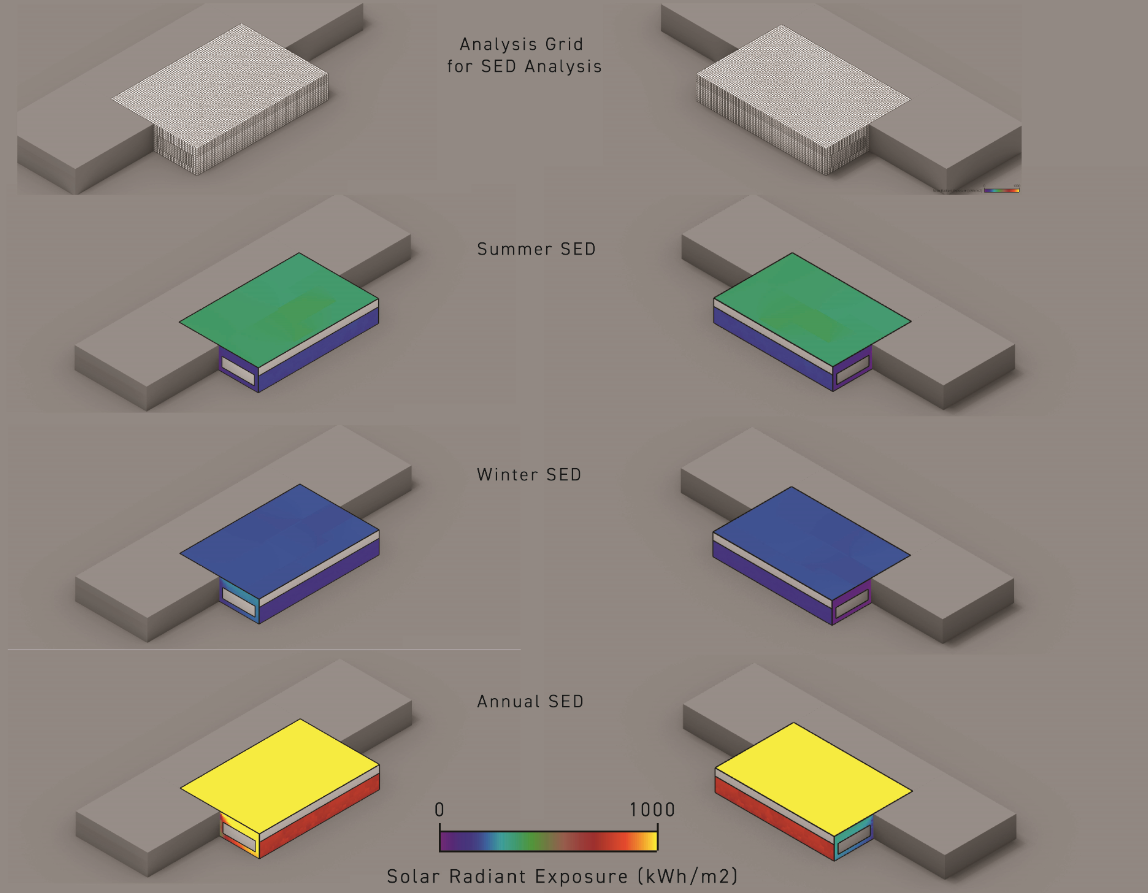
Whole Building Solar Radiation- Annual, Seasonal
The walls of the building have significantly lower solar energy densities as compared to the roof. This can be accounted for by the adjacent building that shades the target building.
The east façade generally receives the most solar energy as compared to the other facades (751.87 kWh/m2 Annual) and this trend is followed in summers (166.79 kWh/m2) and winters(128.94 kWh/m2) as well. This is because there are unobstructed sun rays falling on this facade. During the summer, the east façade receives less solar energy as compared to annually as the azimuth angle is higher, resulting in more solar energy falling on the roof. This indicates a need for having shading devices to reduce the cooling loads of the building.
The southern facade always tends to be shaded by the adjoining building and hence the average SED is observed to be significantly low (373.54 kWh/m2 Annual). This facade can also fall under the consideration for designing shading devices. The northern facade has the lowest energy density, as the sun vectors hardly ever reach that facade (110.51 kWh/m2 Annual).

Solar Radiation for individual facades- Annual, Seasonal

Solar Radiation Exposure
During the Winter with low azimuth angles, the east façade receives the most solar energy. The daylighting hours are shorter, so the other walls receive less sunlight.
The roof surfaces have the highest solar energy density values regardless of season. This is because it is in direct contact with the solar incident rays and does not have any physical obstructions that can intercept the solar incident rays. Considering Pittsburgh’s daily diurnal swing, using the roof as a thermal mass for passive heating can be an option for energy conservation and decreasing heating loads.
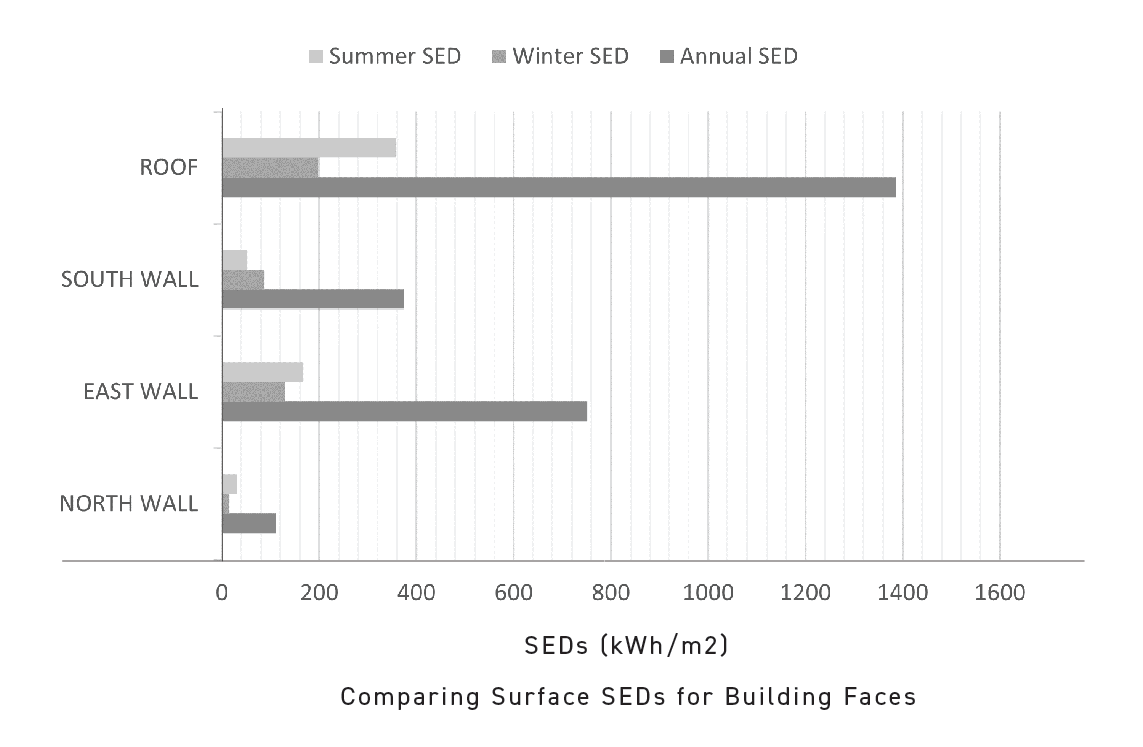
Solar Radiation Analysis Bar Graph for building facades
Roof South Facade East Facade North Facade
Annual SED (kWh/m2) 1386.6 373.54 751.87 110.51
Summer SED (kWh/m2) 357.84 51.57 166.79 29.85
Winter SED (kWh/m2) 197.22 87.86 128.94 15.46
SED II EFFECT OF BUILDING ORIENTATION
Simulation Metric : Solar Energy Density / Solar Radiation
Location : Pittsburgh
Performance Objective(s) : Understand the effect of orientation on the incident solar radiation on the facade surfaces.
Analysis Period : Seasonal (Summer & Winter), Annual
The objective of this section of the study was to understand the effects of solar radiation mapping (Solar Energy Density) on the facades of the given analysis building under consideration, with change in orientation.
Orientation is one of the most important aspects of building parameters that affect the incoming solar radiation, due to the difference in the orientation of the building axis with respect to the incoming solar vectors for the given time and date. Understanding the effect of orientation on the incoming solar radiation and the Solar Energy Density on the corresponding facade serves to be an important performance indicator to direct design decisions, especially those related to the facade and windows. An example design exercise of designing a shading device is shown in the next section.
The initial step was to establish four different orientations for the study with respect to the base orientation. For the purpose of this study, the base orientation is taken to be 0 degrees.
The four orientations considered for this study are as follows :
Orientation 1 Orientation 2 Orientation 3 Orientation 4
0 degrees (Base) 45 degrees 90 degrees 180 degrees
The orientations were chosen as shown above, with the purpose to explore both orthogonal and non-orthogonal orientations, and so that they are in accordance with passive solar architecture principles.
Initially the solar radiations of the roofs are analyzed and visualized. Since roof surfaces don’t have any context surfaces shading the incoming radiation, they get the highest radiation
Understanding the amount of radiation on the roof surfaces can give a rough idea of the total amount of radiation incident on a site, for a given analysis period and location.

Optimal Orientation Study (plan view) 0 degree
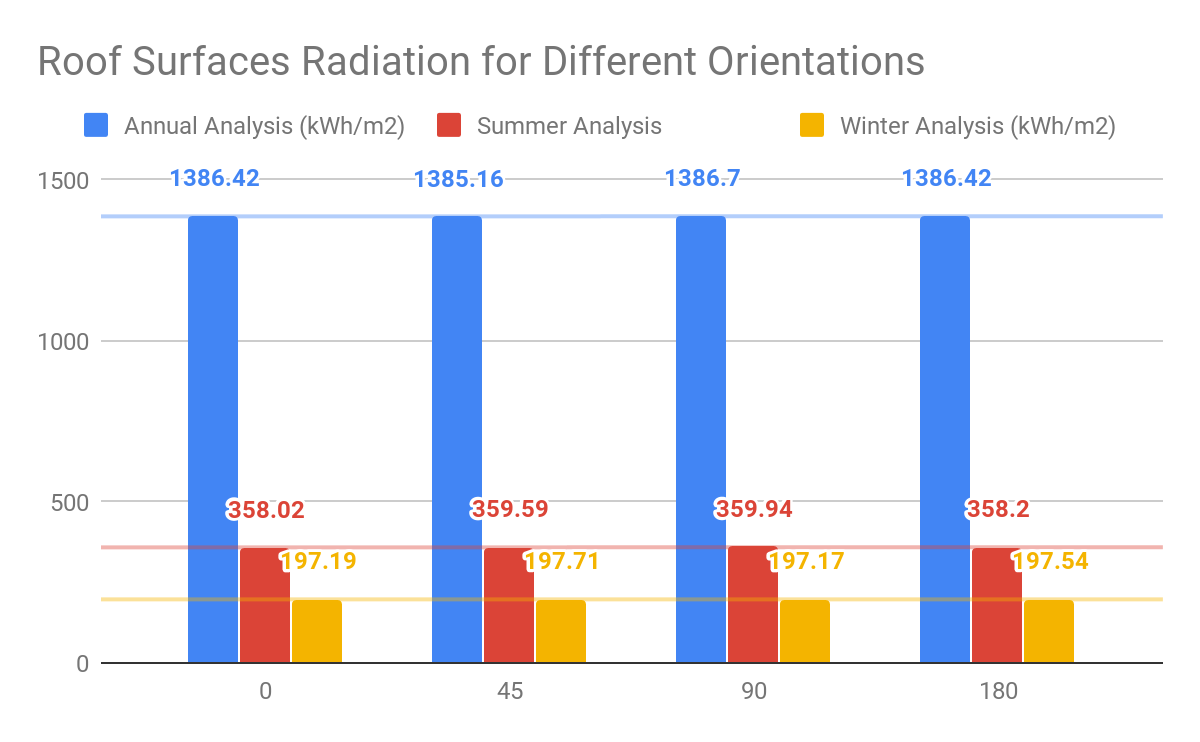
Shown above are the different orientations considered for this study and the amount of radiations on the roofs are also shown above.
As we can notice, the Annual simulation gets the highest result as a result of overall radiation received throughout the year. Once this analysis was done, the next stage was to analyse all the different surfaces of the analysis building for seasonal and annual simulation periods.
Firstly, the analysis of incident radiation and the corresponding solar energy densities on the different facades was done for the Base orientation of 0 degrees. The results are documented below :
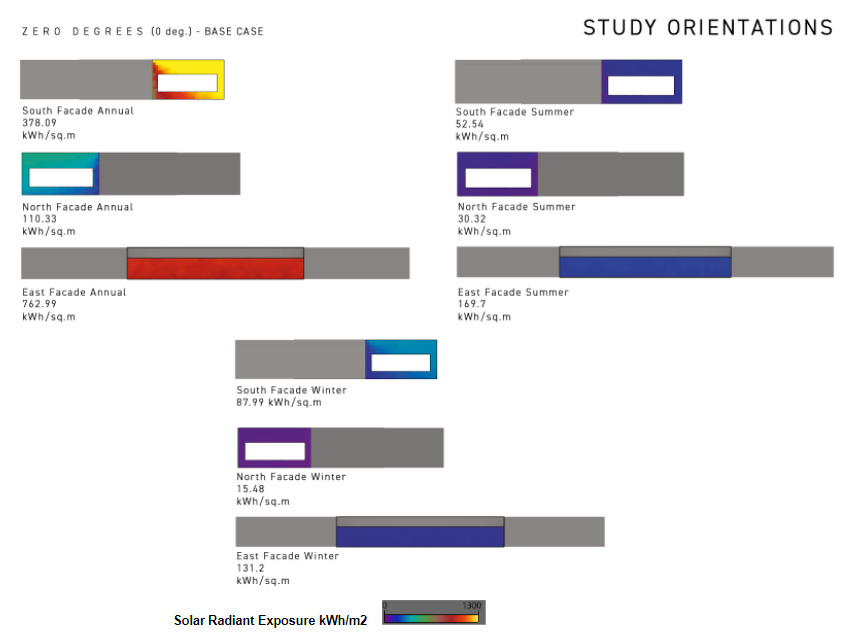
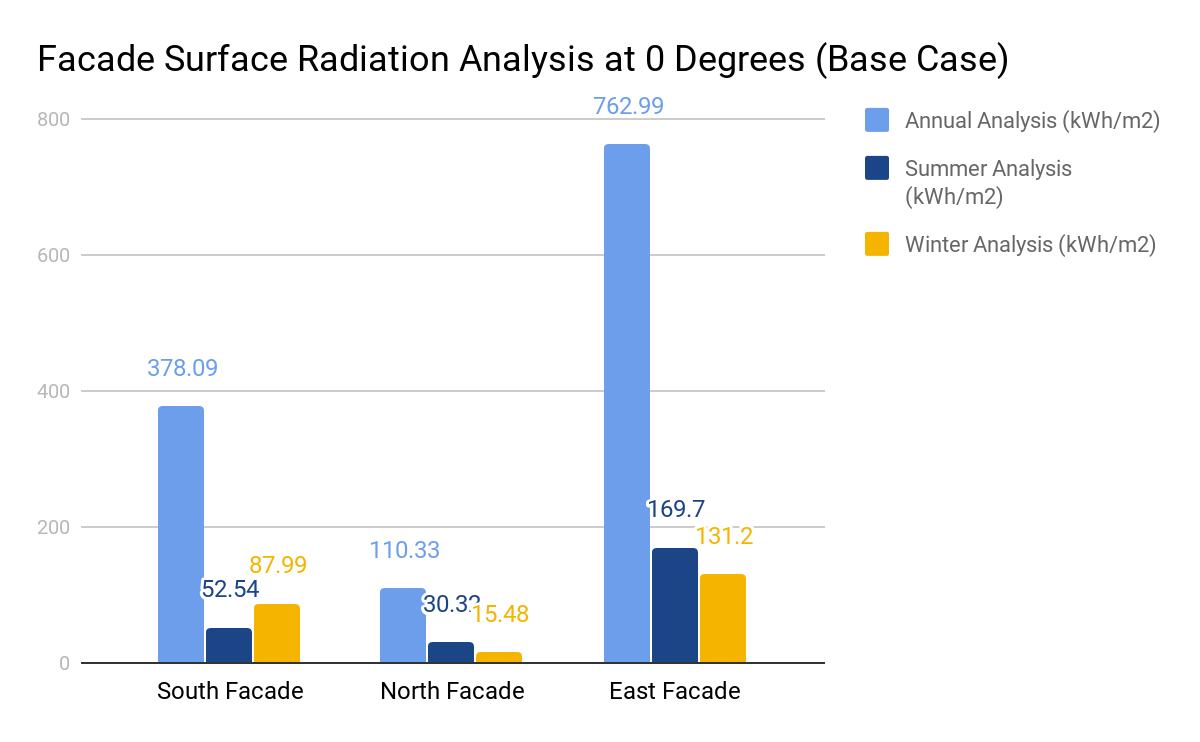
As we can observe from the simulation data above, the eastern facade gets the highest incident radiation amongst the facade surfaces. This is due to the fact that there is no context that is blocking the incident radiation on this facade.
The second highest radiation is received by the south facade, due to its orientation as it relates to the incident sun vectors. The north facade gets the least radiation as it is well shaded by the context building as well as self shading.
Next the same analysis was carried out for the non-orthogonal 45 degree orientation. The results of this simulation are documented below :
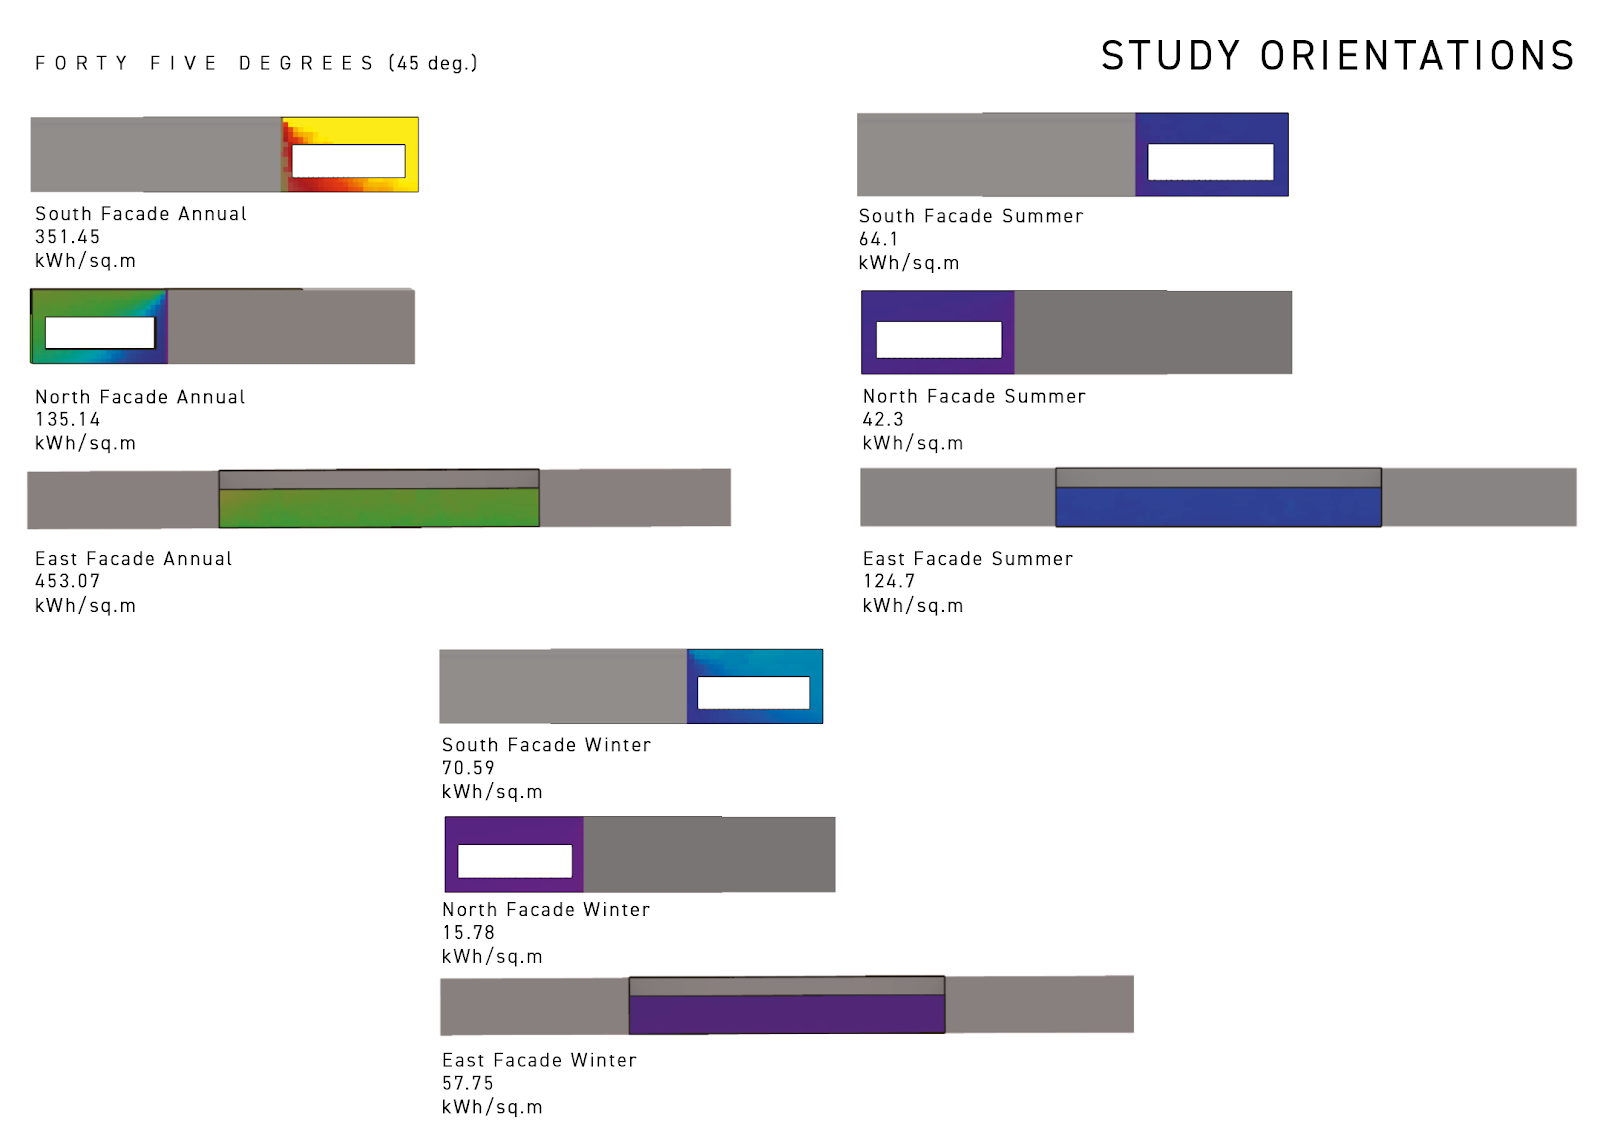

As the above simulation data suggests, the radiation on the east facade has significantly reduced in this orientation due to its relational interaction with the incident solar vectors. The context partially shadows the east facade as compared to it being completely exposed in the base orientation.
Still, the south facade gets the second highest incident radiation due to it’s orientational configuration with the sun vectors. However we can notice that the solar energy densities in the north and south facades are almost becoming equal.
Next, the analysis was carried out for the orthogonal orientation of 90 degrees.
The results of that analysis is as follows :

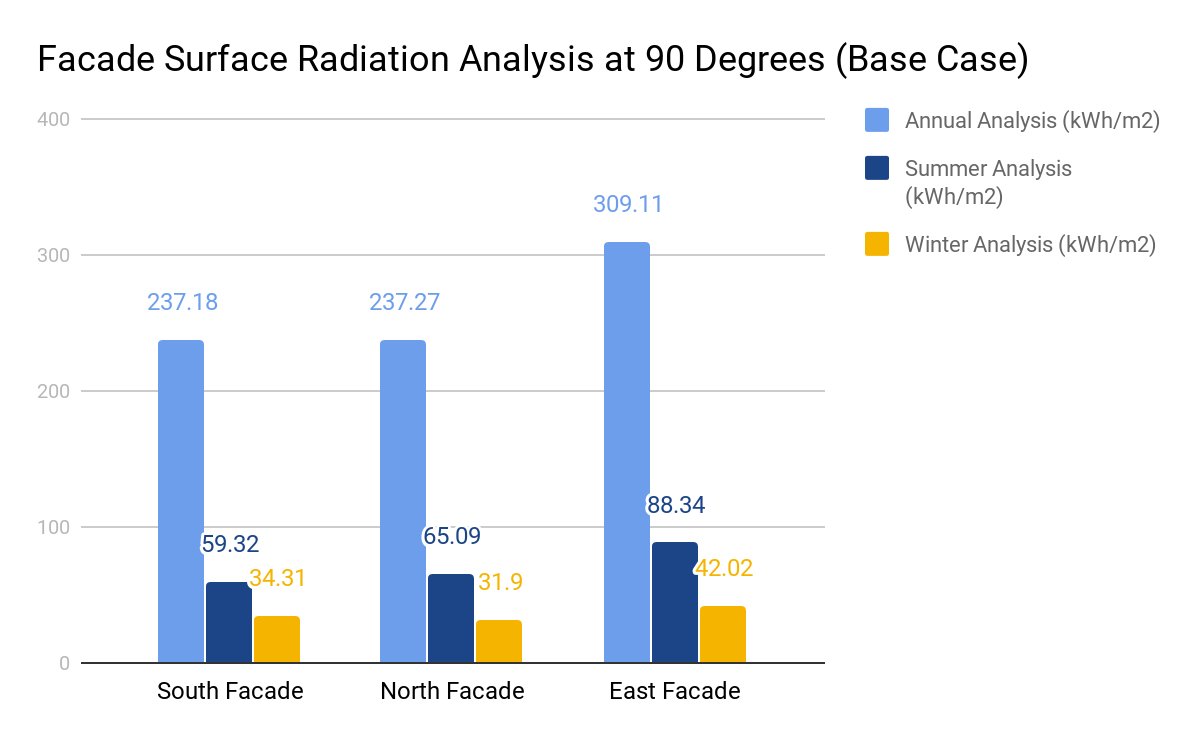
The above simulation results show that in this orientation where the analysis building is rotated 90 degrees with respect to the base case, we can see that the east facade still follows the trend for the facade that gets the most amount of radiation, due to lack of context that obstructs the incident solar vectors.
However, in this orientation, the south and north facades receive almost equal amounts of incoming radiation.
This is due to the fact that they are perfectly oriented in such a way that the context geometries shade the incoming solar vectors symmetrically.
It can also be noticed that comparatively, the east facade receives the least radiation in this orientation amongst the other orientations.
Finally, the last orthogonal orientation of 180 degrees with respect to the base case was analysed.
This is an exact flip of the base case. Results for this orientation are documented below :
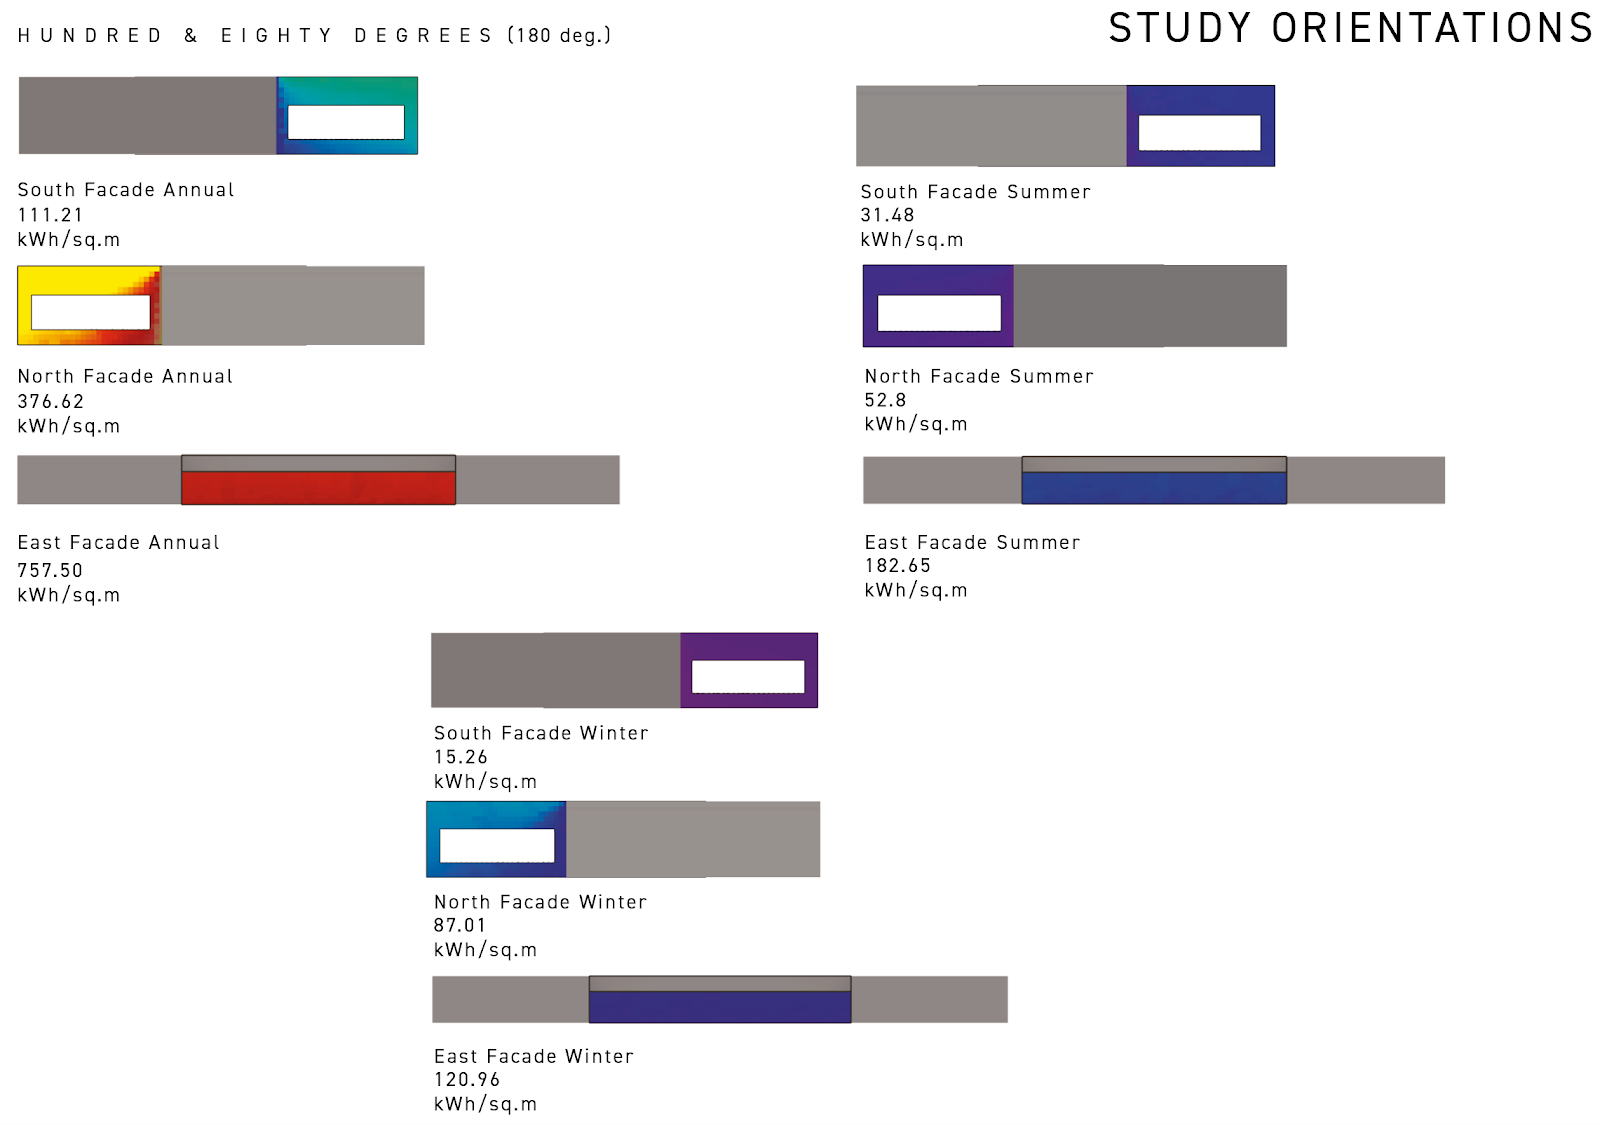
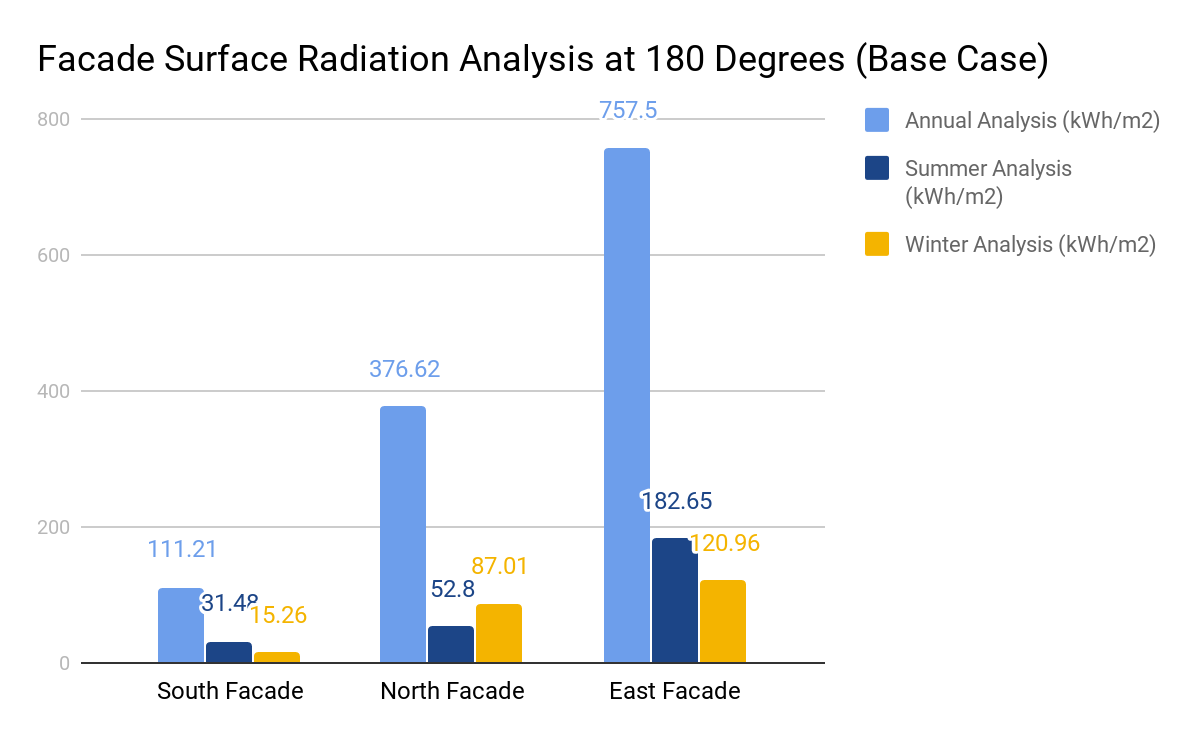
This orientation shows that now, the south and north facades receive radiations that are varying opposite to that in the base case orientation, as this is a flipped version of the base case. The north facade receives more radiation than the south facade due to this orientation. The east facade continues to receive maximum radiation due to the lack of context geometries obstructing the incoming solar radiation vectors.