

Simulation Metric : Point-in-time Radiation Analysis
Location : Pittsburgh
Performance Objective(s) : Maximize Solar Radiation on Site
Analysis Period : Annual, 9:00am - 3:00pm
The solar fan analysis shows the required 3D clearances for solar access for the defined period. This helps in selectively cutting the massing of adjoining buildings and gives prompts for the buildable volume which is defined by planes defined by the solar fan. (technically this plane could be at a higher level to guarantee solar exposure for the facades of surrounding buildings (for passive solar gain) although this obstructs solar access at ground level.)
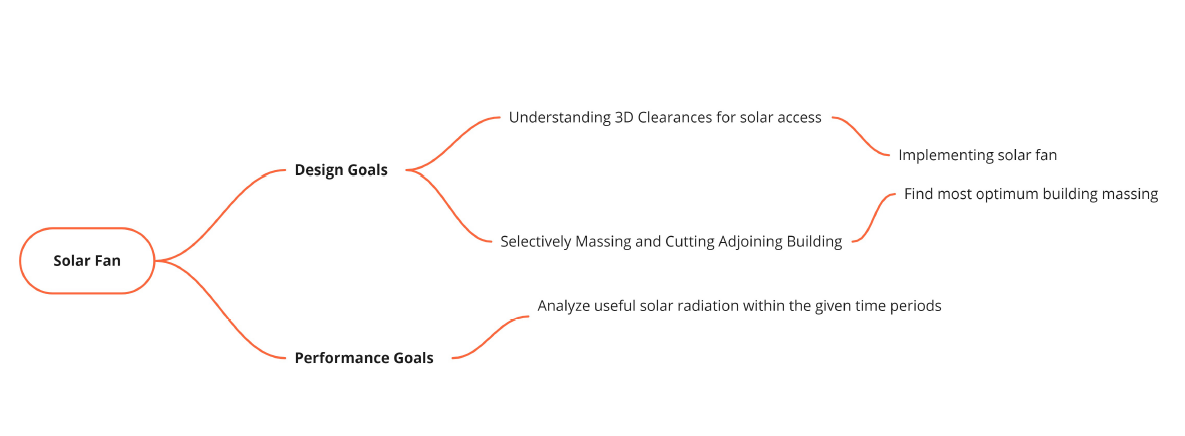
Study Objective
Solar fans constrain density to a point where it can be detrimental to broader urban goals. So if higher densities are needed, one shouldn’t use the Solar Fans so ‘strictly’.
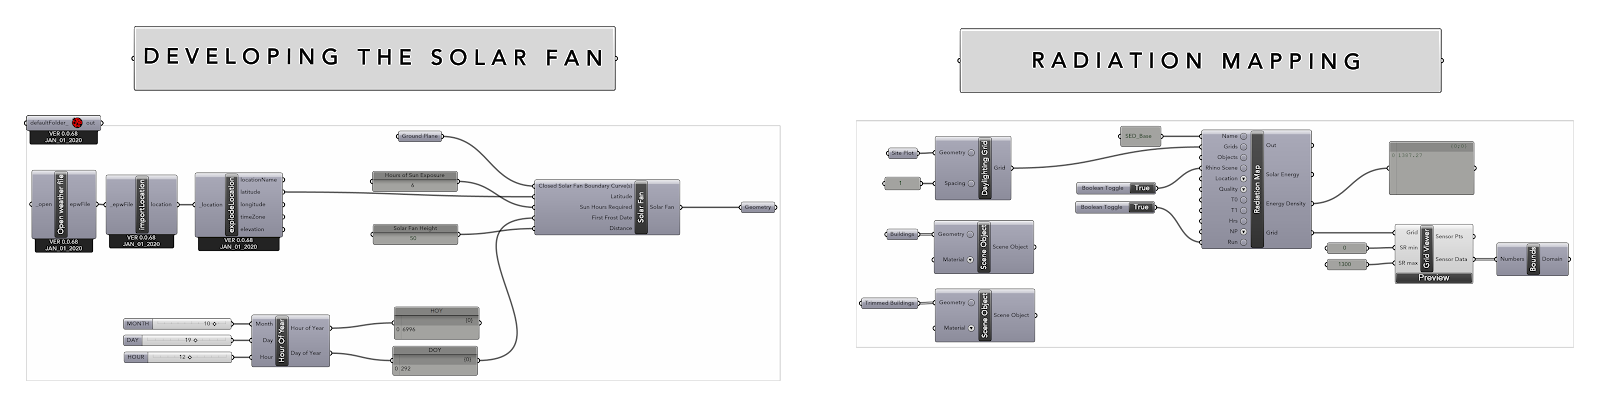
Workflow Script
There are two parts to this analysis as the pseudo script mentioned above. Developing the solar fan requires the user to input mainly the ground plane, the height of the solar fan based on the neighbouring context and the hours of sunlight exposure. This part creates the solar fan.
The second part of the study revolves around radiation mapping for the playground for three scenarios:
Site without Building Context | Site with Building Context (untrimmed) | Site with Building Context (trimmed)
The site provided for the simulation of solar fan was a site that is a playground surrounded by building structures on all four sides in Pittsburgh. A solar fan indicates the block of continuous sunlight received by any given area, as well as the solar energy density of a given time frame.
The first frost date taken for simulation is October 19th for Allegheny County and the hours are 9AM-3PM. Annual solar radiation mapping is simulated with DIVA. The annular solar energy density (SED) of the playground is measured.

Solar Fan Visualization
As displayed, five surrounding buildings have an intersection with solar fan geometry, and this imposes a geometric limit of buildable volume not to obstruct useful solar radiation within the given time periods.
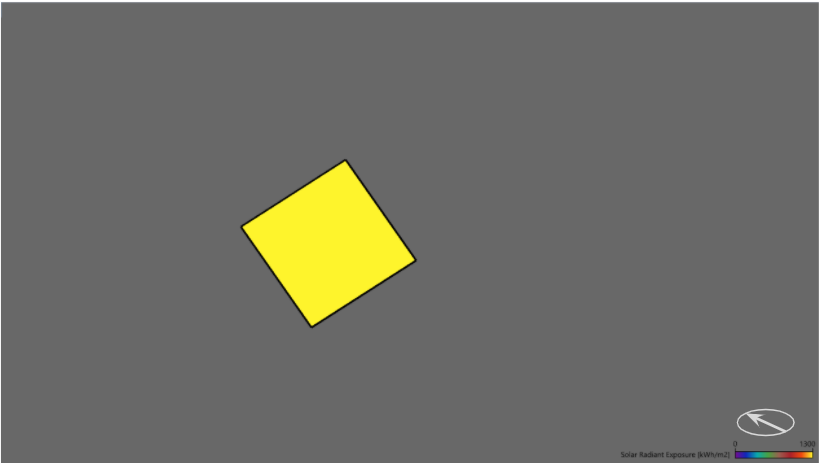
Initial SED study without context
Observation:
As observed in the figure above, the playground without any building context receives an annual solar radiation density indicated by the yellow solar grid.
The solar fan analysis shows the required 3D clearances for solar access for the defined period.
Calculation:
The annual solar energy density of the playground was measured to be 1387.43kWh/m2 before any buildings were constructed.

SED before trimming buildings
Observation:
As observed in the figure above, the playground surrounded by the buildings receives an annual solar radiation density indicated by the red and green solar grid.
Calculation:
The annual solar energy density of the playground was measured in order to calculate the best possible to be 874.63kWh/m2 before the buildings were trimmed.

SED After Trimming Buildings
Observation:
As observed in the figures above, the playground receives a radiation density between indicated by the yellow and orange solar grid. This indicates that the solar radiation on the playground is higher than before the buildings were trimmed and hence an optimum position can be achieved in order to receive maximum solar radiation.
Calculation:
The annual solar energy density of the playground was observed to be 1196.35 kWh/m2 after the buildings were trimmed.

Summary