

LOCATION DATA
Using relevant functions of the Ladybug plug-in extract the following data from the EnergyPlus-based weather (EPW file) for the location of your building case:

Ladybug workflow for location data and weather data
After initial setting up, the (Data Resource from EPW file: USA_PA_Pittsburgh-Allegheny.County.AP.725205_TMY3) is imported from the computer into Ladybug. The basic location data is extracted from the climate data directly. Then, the minimum and maximum values for Dry-Bulb Temperature, Relative Humidity, and Wind Speeds are selected via data range components. The final data is listed in the following tables.
Location : Pittsburgh
Latitude : 40.35° N
Longitude : 79.92°W
Time Zone : GMT-5
Elevation : 380.0m
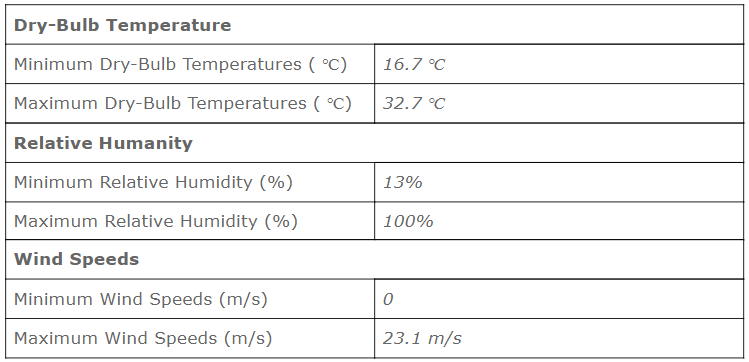
Dry-Bulb Temperature, Relative Humanity, and Wind Speeds
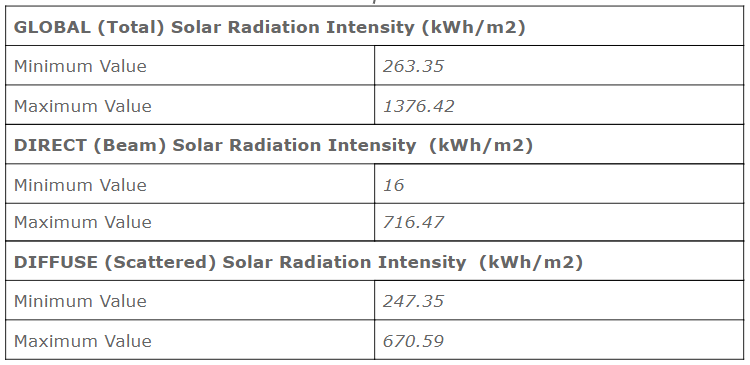
Solar Radiation Values
WIND CONDITIONS
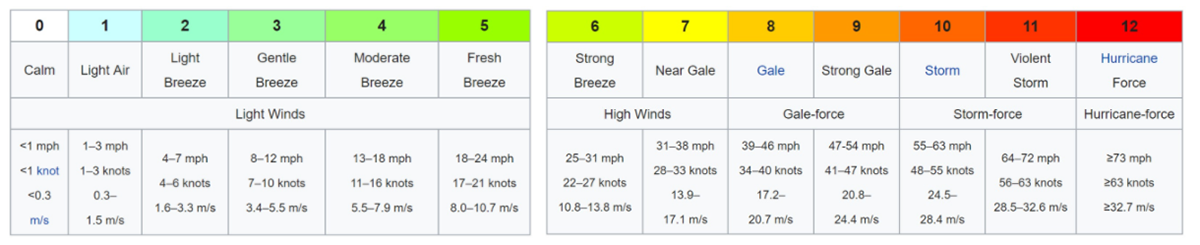
According to Beaufort Wind Scale, there are different levels of wind conditions with the unit in m/s. Using those wind speed parameters as conditional statements in Ladybug, a series of wind rose and speed maps are visualized.
“light air” 0.3-1.5 m/s

“gentle breeze” 3.4-5.5 m/s
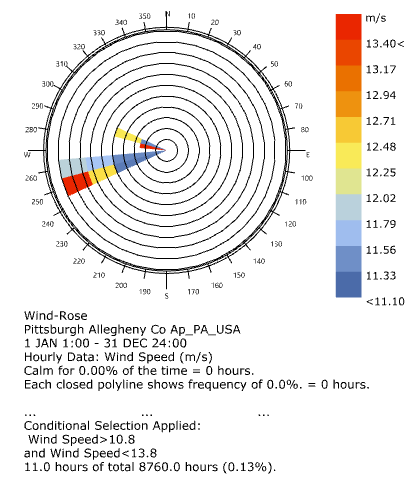
“strong breeze” 10.8-13.8 m/s

“strong gale” 20.8-24.4 m/s
Some wind speed ranges (“calm” 0-0.3 m/s 0-0.3m/s, “Storm” 24.5-28.4 m/s, and “hurricane force” ≥ 32.7 m/s) are not available in Pittsburgh, or almost hardly occur as statistically significant in climate data. In this case, if those wind speed ranges are selected, Ladybug shows “no hour meets this conditional statement”
There are 1183 hours in a year when outdoor (dry-bulb) temperatures are below
freezing level (< 0oC).
Under 10oC balance point temperature, there are 1731.075 hours in HDD (Heating Degree Days) and 1254.025 hours in CDD (Cooling Degree Days).
Under 18.3oC balance point temperature, there are 2997.8 hours in HDD (Heating Degree Days) and 445.35 hours in CDD (Cooling Degree Days).
There are 3920 hours in a year when outdoor (dry-bulb) temperatures are between +/- 8oC from the commonly acceptable indoor set-point temperature of 21oC (using the conditional range 13oC - 29oC).
For the Annual global solar radiation, 298 hours are within overcast/cloudy skies (between 100 and 400 W/m2), and 567 hours are under clear skies (>600W/m2).
Total Skycover in Ladybug includes 1-10 scale. ‘1’ is being clear and ‘10’ is being cloudy. By using this criteria, during a year (of 8760 hours),there are 118 hours when the skies are sunny/clear (sky cover <= 30%) and 3731 hours when the skies are cloudy (sky cover >=70%).
2D-3D Visualization of the Climatic Data
Annual dry-bulb temperatures
The annual dry-bulb temperature maps (2D and 3D) indicate that the high temperature in Pittsburgh is around 32.7℃, and occurs during summer time and morning time through the entire year, with an intermittent fluctuation for each month.

3D Annual Dry-bulb Temperature Maps (Pittsburgh)

2D Annual Dry-bulb Temperature Maps (Pittsburgh)
Relative Humidity (RH) levels
Relative humidity stays at a high level generally in Pittsburgh. High humidity exists during afternoon and evening, and summer and winter have smaller proportions of low relative humidity compared to other seasons. In addition, some low relative humidity situations occur during the evening time of February to May.

3D Annual Relative humidity Maps (Pittsburgh)
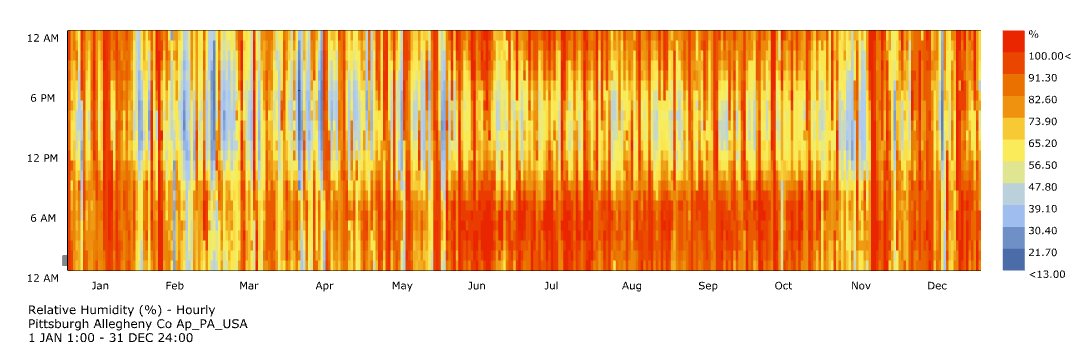
2D Annual Relative humidity Maps (Pittsburgh)
Dry-bulb Temperature (between 21 – 27oC)
Using the conditional statement, the dry bulb temperature (between 21 – 27oC) primarily occurs during summer daytime. The data has a high concentration threshold of 27℃ and it starts showing since early March and ends in late October.

2D Annual Dry-bulb Temperature (between 21 – 27oC) (Pittsburgh)

2D Annual Relative Humidity (between 30-50%) (Pittsburgh)
Spring and winter experience relative humidity of 30-50% whereas the same relative humidity is experienced during summer afternoons. The following figure shows that 50% relative humidity is common during the year. Depending on individual differences, if 30-50% of relative humidity is not suitable, a mechanical system needs to be deployed, especially from October to May.
Climate Consultant 6.0 is utilized as a supplemental tool for this part and the climate file is still the same as the one used in the previous simulation ( EPW file: USA_PA_Pittsburgh-Allegheny.County.AP.725205_TMY3)

Climate Consultant Dry-Bulb Temperature (May to Sep) with Design Strategies (Pittsburgh)
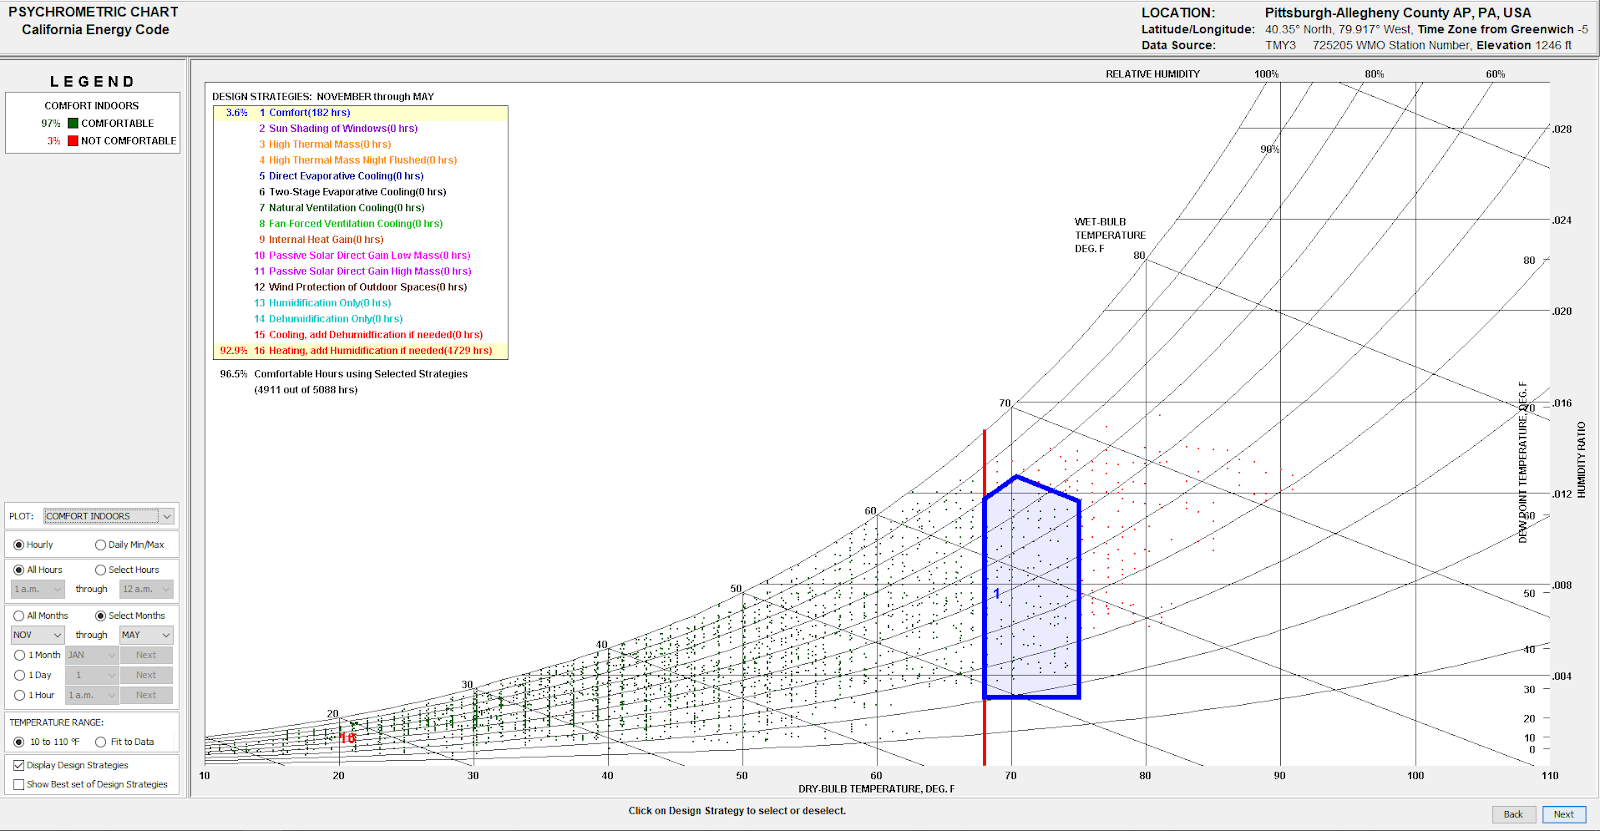
Climate Consultant Dry-Bulb Temperature (May to Sep) with Design Strategies (Pittsburgh)
Corresponding to dry-bulb temperature (between 21 – 27oC), the most frequent data generally occurs from May to September. Using the aforementioned time frame in Climate Consultant, a basic comfort level of 12.8% can be achieved, the psychrometric chart shows natural ventilation could improve to 23.3%. Heating and humidification if added could improve the comfort level to 53.5%. Other design strategies have lower positive impact to improve comfort.
Corresponding to relative humidity (30-50%), most of this humidity level occurs from November to May. Using the aforementioned time frame in Climate Consultant, the results show heating and humidification if added could improve indoor comfort to 92.9%, which is a dramatic increase.
Based on the analysis for now, Natural Ventilation (operable window) is recommended during summer and HVAC (especially Heating and Humidification) is recommended for other seasons. For the design suggestions, although the occupant may not open windows during winter time, using operable windows is effective. Heating and humidification mechanical systems are prioritized for the building in Pittsburgh. For further information, more detailed analysis will be required for specific building type and practical constraints.
Wind Rose and Wind Speed Analyses

Wind Rose and Speeds Setting
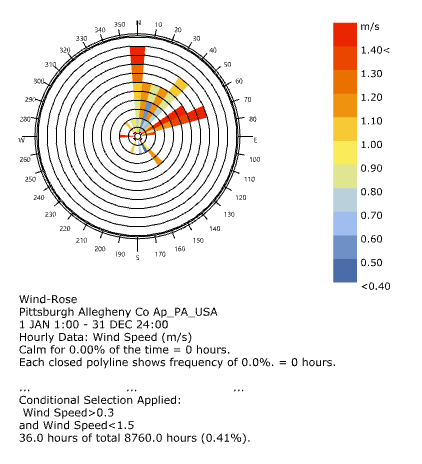
The wind rose and wind analysis use a wind speed calculator and wind rose component. The default period is set for the entire year and a conditional statement is used to select specific wind speed ranges from the local climate file. It also uses the same graphCurve setting as the previous step.
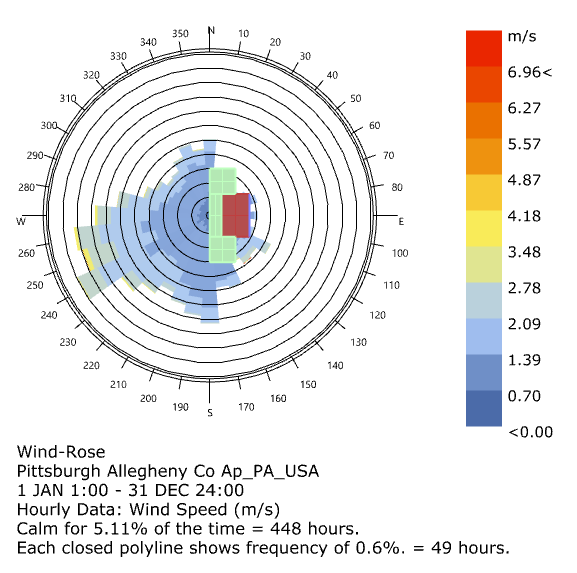
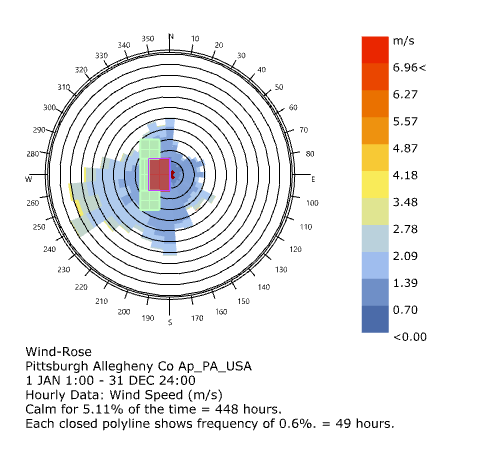
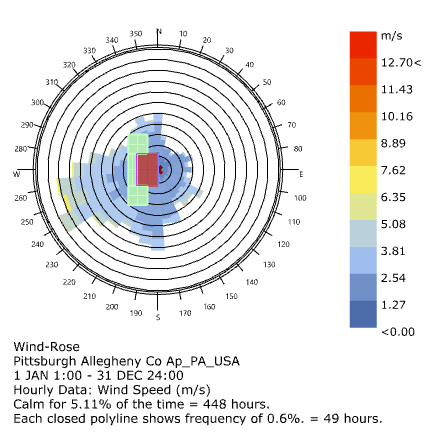
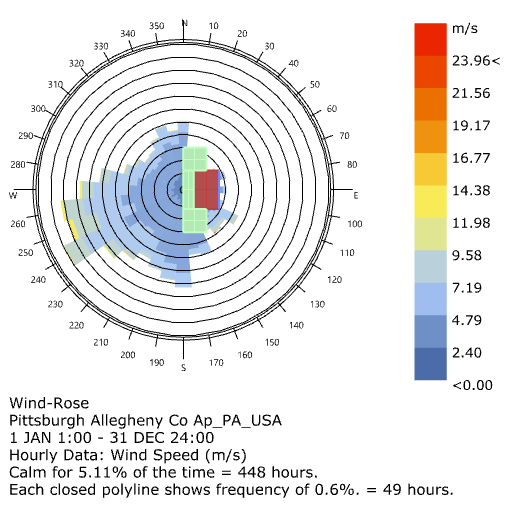
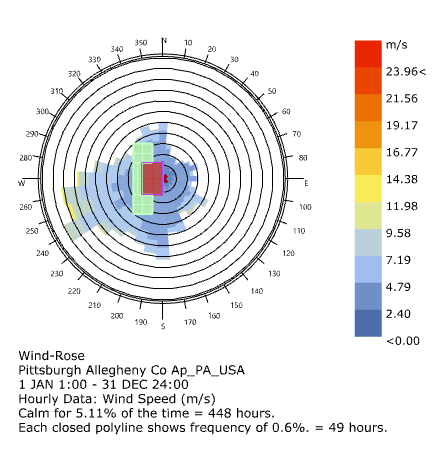
Wind rose and wind speed map
This part sets the wind rose and speed at building height (3m). The prevailing wind comes from the south-west direction, around 240° to 270°. As the prevailing wind hits the neighbor building, the visualization selects two base points. One is in the centroid of the vertical face of the neighbor building (west green building in the top view). The other is the centroid of the vertical face of the target building (red building in the top view). Under those two scenarios, the wind near the building frontage and prevailing wind direction are both available for analysis.
Terrain 0 Wind at Neighbor Building
Terrain 0 Wind at Target Building

Terrain 2 Wind at Neighbor Building
Terrain 2 Wind at Target Building
Terrain 3 Wind at Neighbor Building
Terrain 3 Wind at Target Building
By using the terrain conditional command in Ladybug, wind analysis in different terrain types shows wind direction stays consistent in various terrain types, while the wind speed changes. By comparing wind rose maps in different terrain types, in Pittsburgh prevailing wind comes from the southeast direction with some frequent wind from both the north and south. As the neighboring buildings (green) located on the west side of the primary building (red), the building is blocked from most of the prevailing wind. Window direction stays constant in all scenarios. However, the color legend shows the wind speed increases from City to Suburban and from County to Water. It suggests the wind speed drops when there are more obstructions. For example, more buildings in the city and more trees in suburban/county serve as the barrier for wind fluid, compared to the water area. Typically, wind speed is lower in the city, compared to other terrain types. Therefore, for some locations with higher wind speeds, wind protection strategies need to be considered.